GLtoy Documentation
(Version:
25 March 2018)
Copyright 2018 Burney Waring
Copyright 2018 Burney Waring
Installing GLtoy
Using GLtoy
GLtoy Cases and Challenges
GLtoy Construction
GLtoy License
Contact Burney Waring
Using GLtoy

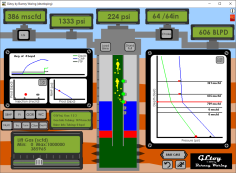
The GLtoy interface has many parts. Drag and drop the slider in the lower left of the screen to change the value of Lift Gas to about 300,000. Many parts on the screen will start changing.
Gas lift is the injection of high pressure gas into a well, and works by reducing the overall density of fluid in the production flowstream (i.e. into the tubing). Gas goes into the casing annulus of the well, then through gas lift valves into the tubing.
In the central part of the screen is the well. The yellow things in the center are bubbles in the tubing. They are my representation, not an actual prediction of flow regimes. The long, skinny bubbles are called "Taylor bubbles". In the lab, they are usually followed by a trail of finer bubbles and other, separate bubbles. This is what flow looks like (in a lab). Gas lift should be mostly in the bubble, slug and maybe churn regimes. If the gas rate is quite high, it will go to annular or mist flow, but friction is hurting the well at that point, probably.
The blue color is representing the fluid in the casing. This should be completion brine. The brine is displaced by gas lift injection gas (the white area above the blue). This moves into the tubing and shows as the yellow bubbles. The green color represents fluid from the well formation.
The tubing itself is in the center of the well, the gray color. The small shapes on the right side of the tubing are the gas lift mandrels. All of them will be gray, except for one which will be red. The red one is the mandrel that is currently selected.
You can select a mandrel by clicking on it, or by using the selector slider in the lower left, which will be described below. The bright green dot(s) on the mandrels indicate when the valve or orifice in the mandrel is open and passing gas from the casing into the tubing.
In the center top of the screen, on top of the well is a green display of the Flowing Tubing Pressure. This is the pressure at the top of the well and upstream of the well choke.
Next to it, just to the right is the size display for the wellhead choke. Chokes are intended to cause a pressure drop in the system, which turns the system potential energy into friction, then waste heat, in order to limit the rate of flow from a well. In gas lift wells, chokes should be fully opened (or removed) unless absolutely necessary as leaving a well choked just wastes energy that was put into compressing the lift gas. The size of wellhead chokes is often written as 64ths of an inch. Below this display is a small gray button labeled "Choke". You can change the size of the choke by clicking this button, then moving the slider in the lower left of the interface. A smaller choke size will increase the Flowing Tubing Pressure and lower the production rate.
The green display to the right of the choke, the one in the top right-hand corner, is the the barrels of liquid per day being produced. More liquid produced is better performance as far as gas lift is concerned. This is the instantaneous rate of liquid production.
Below, on the far right, is the Depth vs Pressure graph. The depths on this graph match the depths represented in the well, in the center of the interface. On the white background, there is a green line, green when the well is producing. The green line shows the pressures in the tubing with depth. At the base of the green line is a red dot, which is the Flowing Bottomhole Pressure (FBHP). When this pressure is lower, the well has more 'drawdown' and production will increase. There is a black dot on the same level, and that is the Static Bottomhole Pressure (SBHP). SBHP - FBHP = drawdown.
The blue line is the casing pressure. The top part of the line is has a very steep slope. On this diagram a steep slope represents a low density, a low psi/ft. The top part of the casing is filled with gas. The lower part of this line is less steep because it is filled with completion brine, which is much denser.
Also on the Depth vs Pressure graph, are horizontal black lines, which represent the mandrel depths.
Below each mandrel, on the right is the rate of gas (mcfd) through the valve written in black, or rate of brine (blpd) through the valve written in blue, passing from the casing to the tubing.
At each mandrel depth, there may also be a red and green dot. These are the valve opening pressures (green, larger dot) and the valve closing pressures (red, smaller dot) pressures for each gas lift valve.
There are 4 main types of valves in GLtoy. Each has its own rules for when to open and when to close:
- A "Dummy" valve doesn't ever open. It is actually just a piece of metal with no holes to open.
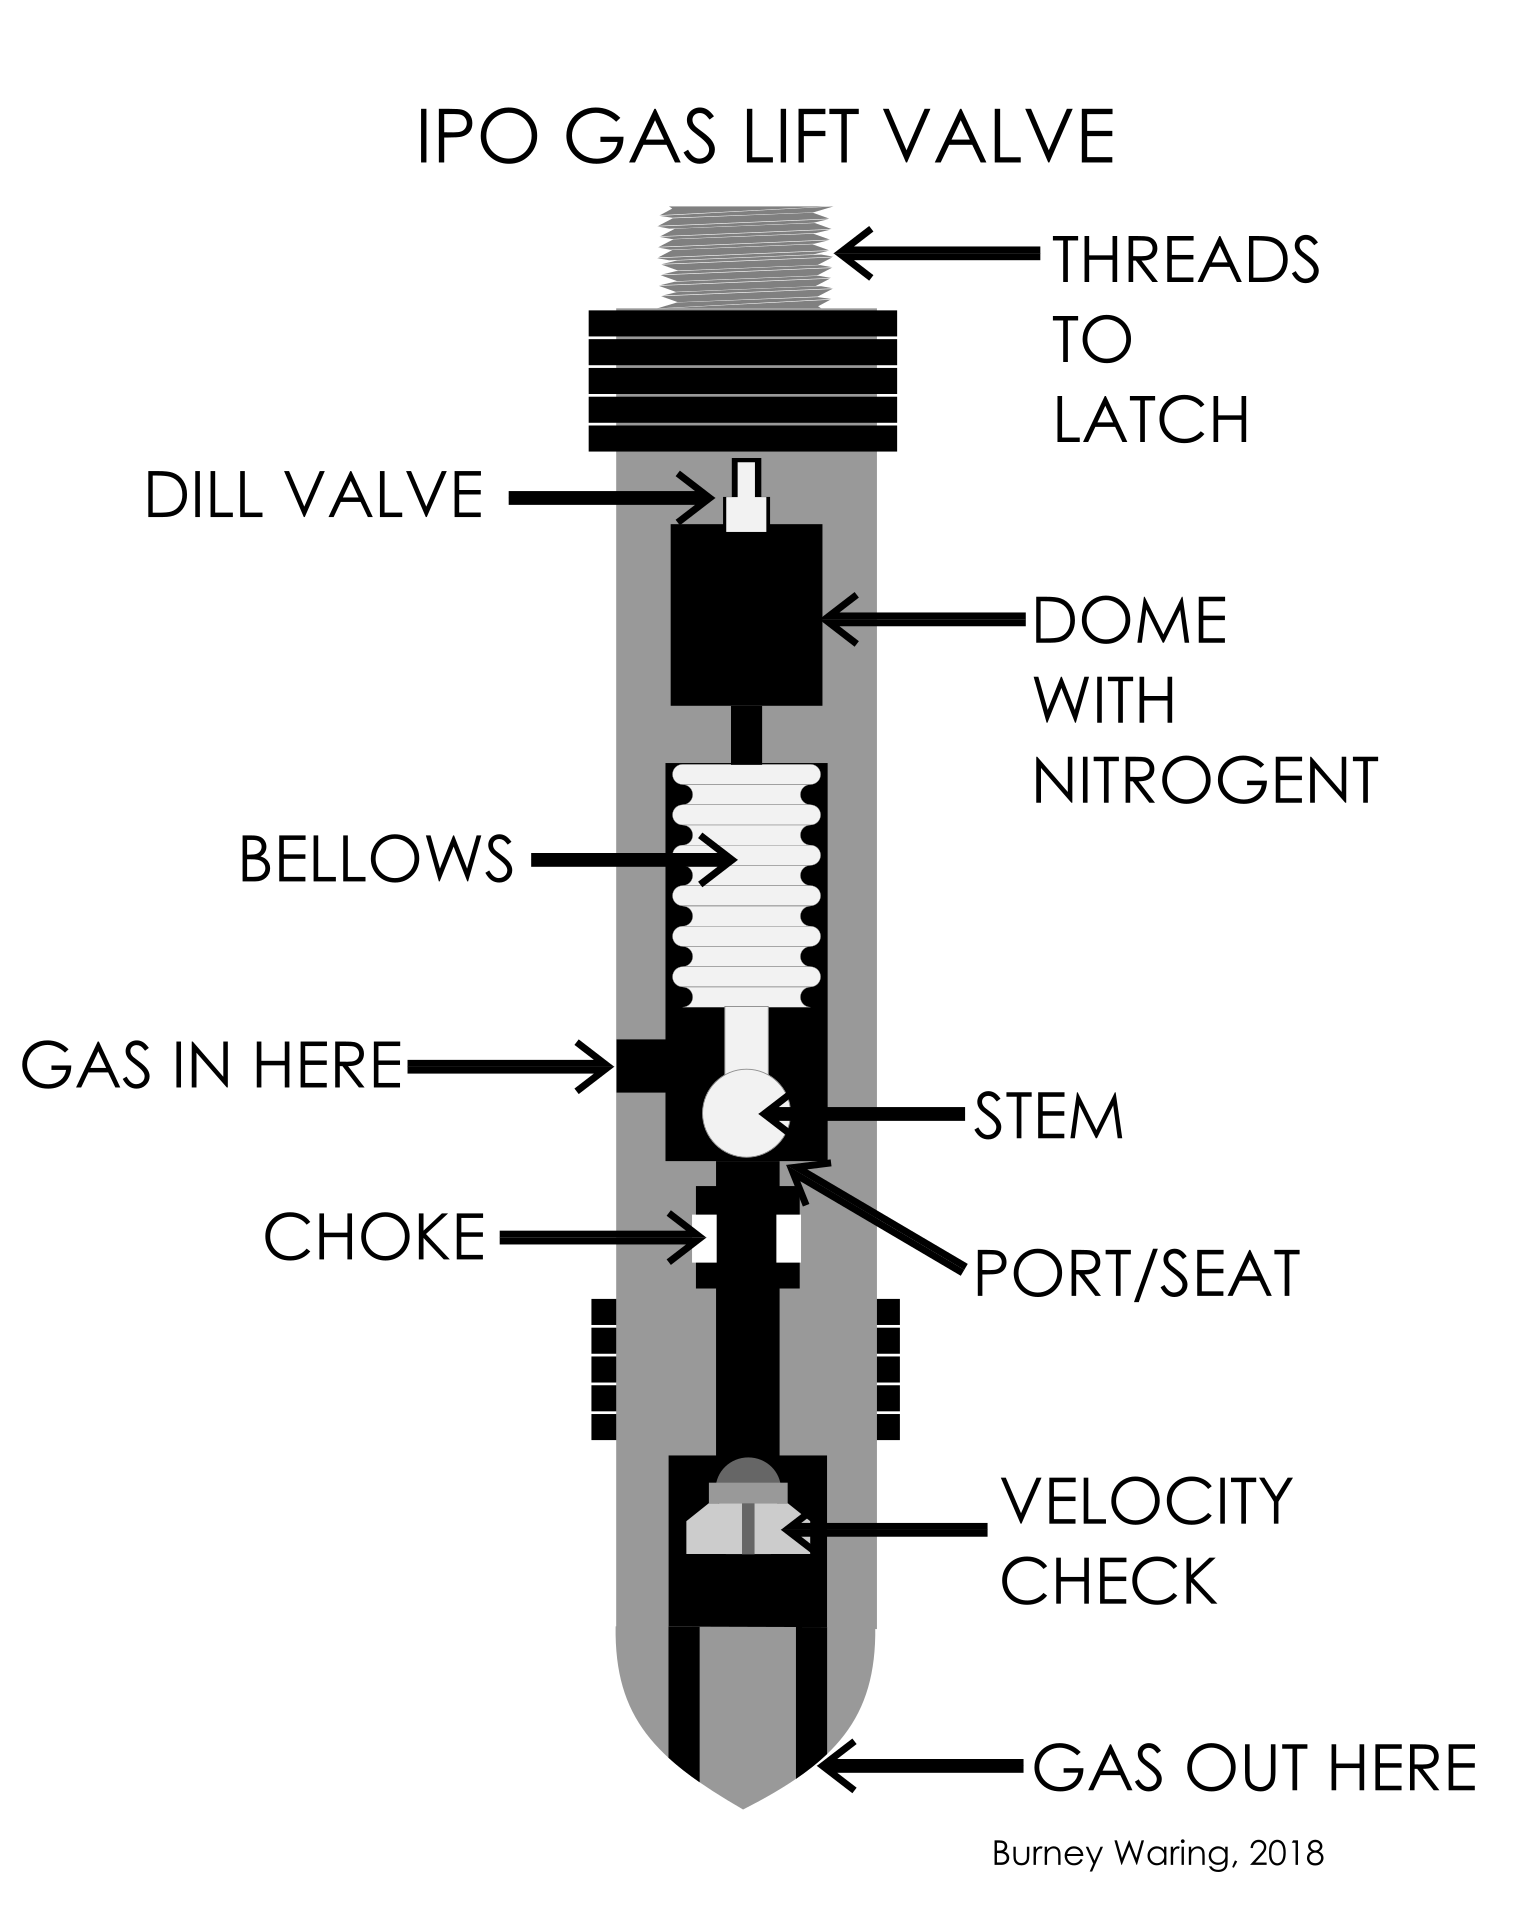
- An "Orifice" valve is always open. It is like the IPO valve shown, just without the bellows and stem. If the casing pressure is higher than the tubing pressure, it will allow flow from casing to tubing. If the tubing pressure is higher than the casing pressure, a check valve prevents flow.
- In an Injection Pressure Operated or "IPO valve", if the injection pressure is higher than the opening pressure, the valve is open. If it is lower than the closing pressure, then it is closed. If it is between the two, and the valve is closed it will stay closed unless it exceeds the opening pressure. If it is between the two, and the valve is open, it will stay open unless the injection pressure falls below the closing pressure. This sort of valve also has a check valve to prevent flow from tubing to casing.
- In a Production Pressure Operated or "PPO valve", if the tubing pressure is higher than the opening pressure, the valve is open. If it is lower than the closing pressure, then it is closed. The closing pressure is higher than the opening pressure, so the valve is generally open when the tubing pressure is more than the opening pressure and closed when it is less.
There is a gray button on the Depth vs Pressure graph that says, "Calc EQC". Clicking this button calculates the equilibrium curve, which is the pressure in the well if lifting from a given depth. The equilibrium curve is not drawn where lifting from that depth would produce no flow. In GLtoy, the EQC sometimes does not compute correctly. This is largely because GLtoy is a dynamic simulation and the technique to calculate the EQC is a steady state one. So, it's not perfect. I decided not to remove this functionality, because it might at least show people what an equilibrium curve is. But, in this simulation, it isn't very helpful.
Below the Depth vs Pressure graph is a gray button with two arrow sides, that says "BASE CASE". Click the Case button and you will take a tour through all the Cases. You can go forwards or backwards. Each case will be explained in the document on GLtoy Cases.
Below the Case button are two buttons. The one on the left is the 'Reset Button'. This will reset the program back to the Base Case.
The one on the right that looks like a running man is the Simulation Speed button. Clicking this and then changing the slider in the lower left will slow-down or speed-up the simulation. This is very useful. The Simulation Speed value is the length of each timestep of the simulator. The default value is 1 minute. Steps can be as slow as 0.01 minutes or as fast as 5 minutes. For reference, GLtoy generates up to 30 timesteps per second, but depends on the speed of the computer which may make this value a bit less. So, the simulator normally runs about 1800 times reality, but can be slowed to as little as 18 times and sped up to about 9000 times reality. It can also be set to a timestep of zero, which effectively pauses the simulation.
Continuing clockwise, in the lower left is the multi-variable slider. This is where all the input to GLtoy is made. First click a gray button, then slide the slider to change a value, if necessary. Above the slider is a description of the value including the units, as well as the minimum and maximum values that can be entered.
Just above the slider window is a Num button. This allows selecting of a mandrel, numbered 1 to 5 (or 7 or whatever the number of mandrels in the well), with 1 being the top mandrel.
Next to the Num button is a group of 4 other buttons. "Tro" stands for "test rack opening" pressure. This is the method for setting the valve opening and closing pressure of the valve in the selected mandrel. Use the slider to change the Tro setting.
The next button is "Type". This is allows you to select the model of valve to put in the mandrel. There are 5 types of valves in GLtoy. There are the 4 main types: Dummy, Orifice, IPO and PPO. The IPO valves has two sizes. "1 x 3/16 IPO valve" means a 1 inch diameter IPO valve with a 3/16 inch diameter port. There is also a "1 1/2 x 1/2 IPO valve" which is 1.5 inch IPO with a 0.5 inch port. Finally, there is a "1 x 3/16 PPO vavle" which is a 1 inch diameter PPO vavle with a 3/16 inch diameter port. Use the slider to change the type of the valve in the selected mandrel.
"Csize" means choke size. Referring to the picture above, a choke can be installed to regulate the gas through the valve more precisely. It has another effect which is to hold additional pressure on the bellows when gas is passing through an IPO valve. Counter-intuitively, this improves the gas-passage performance of the valve. In a PPO valve, a choke is almost always placed upstream of the bellows so that the tubing pressure can act on the bellows. In GLtoy, the choke, not the port/seat, determines the gas passage based on a square-edged orifice equation. If you would like to simulate a valve with no choke, use a choke size equal to the port size. In reality, valve performance varies by manufacturer and model and can be much worse than a square-edged orifice calculation.
"Depth" refers to the depth of the selected mandrel. Use the slider to change the depth, although it cannot move past the mandrel above or below.
Above the Num button is the Static Bottomhole Pressure (SBHP) button. Next to that is the Productivity Index (PI) button. SBHP and PI are related to well inflow performance: Liquid Rate = (SBHP-FBHP)*PI
Gas Oil Ratio (GOR) is the next button. Water Cut (WC) is the last of these buttons. These are important properties of the well production, which define how much gas and how much water and oil are associated with a given amount of liquid rate production.
To the right, just next to the buttons just described above, is a small green display. "GLV Inj. Gas" gives the list of mandrels through which gas is being injected. "Gas Into Tubing" is the total gas rate through all the mandrels. It is very helpful to compare this value with the Lift Gas Injection value in the upper left corner. If the Lift Gas Injection is smaller, the casing pressure will fall. If it is bigger, the casing pressure will rise. "Brine into Tubing" is the total amount of completion brine going into the tubing from the casing through the mandrels.
Above this are three white graph areas.
The lower left of these three is the Production versus Injection graph. The large red dot is the current liquid production, versus the current setting of the Lift Gas Injection rate. The smaller blue dot is the same current liquid production but versus the total gas into the tubing. Notice how the red dot only moves up and down with the production rate, after a lift gas injection rate is changed. The blue dot shows how the rate into the well changes as the well tries to reach equilibrium. The blue dot can move very quickly, so it is mirrored by a group of grey dots, that represent the last 100 points.
This graph has a button, "Calc. LGP", which stands for "Calculate Lift Gas Performance Curve". GLtoy tries to generate a curve which shows how the red dot would move with various gas lift rates. Clicking this button will generate a curve if the well has lift gas being injected, and assumes the lift gas will remain injecting at that depth, continuously. It also generates the approximate differential oil production to lift gas rate, at the current lift gas rate. Since every point on the curve has a different value, this is an approximation. This is a bit of a difficult job for a simulator, so the value may not be correct. But, it should give an idea of the worth of additional lift gas or cost of less lift gas in terms of oil production.
The graph just to the right of the above is the FBHP Pressure vs Rate graph. The line represents the formula, Liquid Rate = (SBHP-FBHP)*PI. The red dot is the current point.
Above this is a wider graph of "realtime values" with the Liquid rate, the Casinghead Pressure (CHP), and the Flowing Tubing Pressure (FTP). The CHP and FTP represent the pressures at the top of the casing and tubing, respectively. The graph is 480 timesteps wide, or 8 hours at the default Simulation Speed value of 1.0, 1 minute per timestep in the simulation. Increasing the Simulation Speed changes the range of time represented by the 480 timesteps. At a value of 5, the range of time is 5 times larger. At a value of zero, the range is effectively infinite, meaning the same values will be graphed for all timesteps.
Remember, GLtoy is a TOY. It may or may not represent the time periods or behaviors seen in the real world for the same reactions!
Above this graph is the LG button. Clicking on this button will allow you to change the Lift Gas Injection Rate using the slider in the lower left. The Lift Gas Rate will be shown in the green display just above this. This is the lift gas rate that the controller supplies to the well, not necessarily how much gas goes into the well. If the CHP reaches the maximum system injection pressure (for most cases in GLtoy this is 1440 psi), the controller will not be able to open further to actually supply the higher rate as displayed.
The green display just to the right is the Casing Head Pressure (CHP).
In the middle of the screen at the top of the well are two buttons. One is "Load Brine". This puts a casing full of completion brine into the annulus of the well. This is very useful for testing to see if a design could unload the well. So, when you change a Tro value or a choke size or depth, etc. Click this button to see if the design works.
Next to this, on the other side of the well is the "Stand Full" button. This toggles between two modes. The default mode is that the tubing will stand full of liquid, even if this liquid generates a pressure higher than the FBHP of the well. This is very useful to test unloading in the worst case scenario, which is either a standing valve at the bottom of the tubing (which could happen if the tubing were tested at the end of the completion installation), or some mud/debris plugging the perforations and creating an overbalance. Generally, gas lift designs should cope with this worst case, unless the designer is sure that such a situation doesn't apply. The other mode is that the tubing level will equalize, according to the SBHP of the well.
Finally, there are two small buttons in the upper right. The upper one, the Info icon, accesses the help documentation. The lower one, the reddish book icon accesses the page where you can buy my book, which I think you will enjoy, if you enjoy production well surveillance, analysis, and optimization.